If you bought a home in Oakville in October, you very likely paid less than the asking price. Of the 189 residential sales in RoofUp's tally of resale listings for the month, 90.5% went below asking, up from 85.8% in September and close to the 92.5% RoofUp reported last December. RoofUp, which compiles sales from the Multiple Listing Service (MLS) that realtors use to list homes, says that gives buyers negotiating leverage.
On average, Oakville homes sold for 95.0% of their list price. Going over asking was uncommon: 7.9% of sales did, about half the rate across Ontario, where 15.4% of sales went over.
Sellers also waited longer. The average home took 37 days to sell, five more than in September, though Oakville still moved slightly faster than the province as a whole, where the average was 39 days.
| Measure | September | October |
|---|---|---|
| Average sold price | $1,355,848 | $1,368,279 |
| Share sold below asking | 85.8% | 90.5% |
| Average days to sell | 32 | 37 |
Prices, meanwhile, barely moved from September: the average sold price rose 0.9%. The bigger gap is with the spring. In April, the town's average was $1,606,870, so October's average sat 14.8% lower. That compares the mix of homes sold each month, not what any one house is worth.
A few very expensive sales pull the average up. The median, the price in the middle of all sales, was $1,180,000, while the priciest home went for $8,300,000.
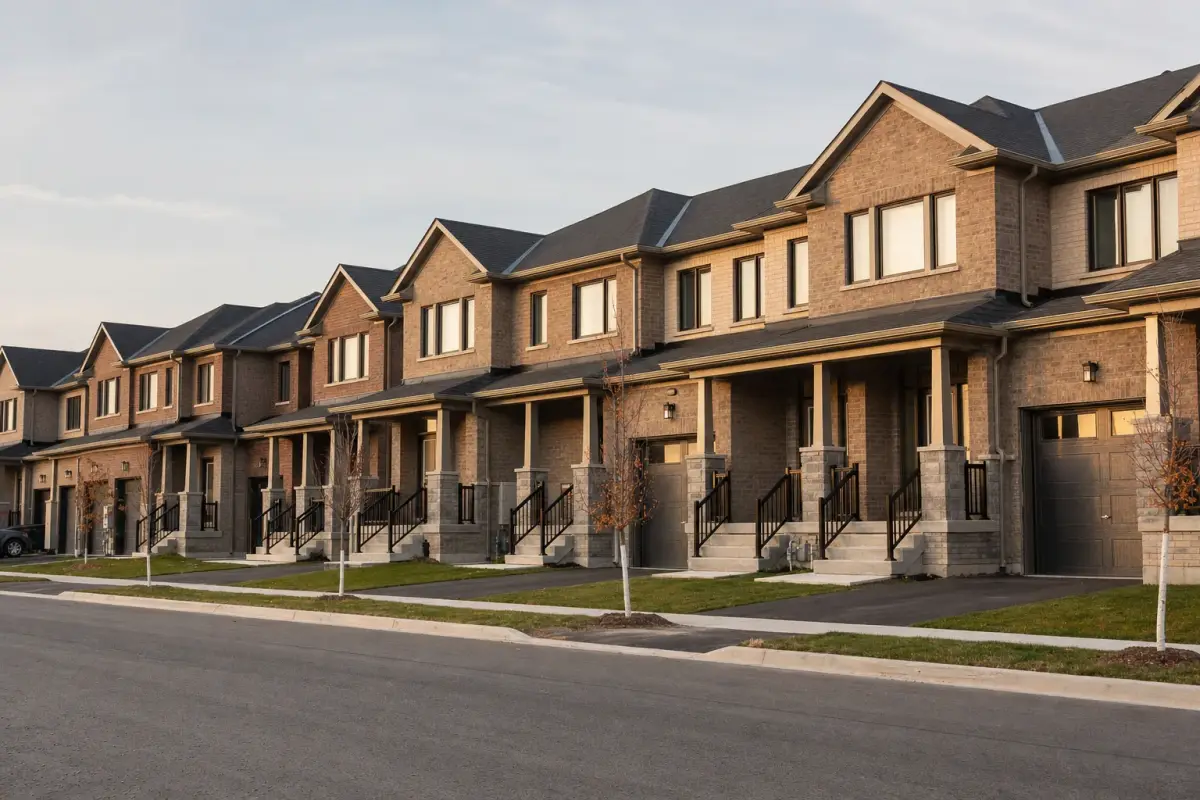
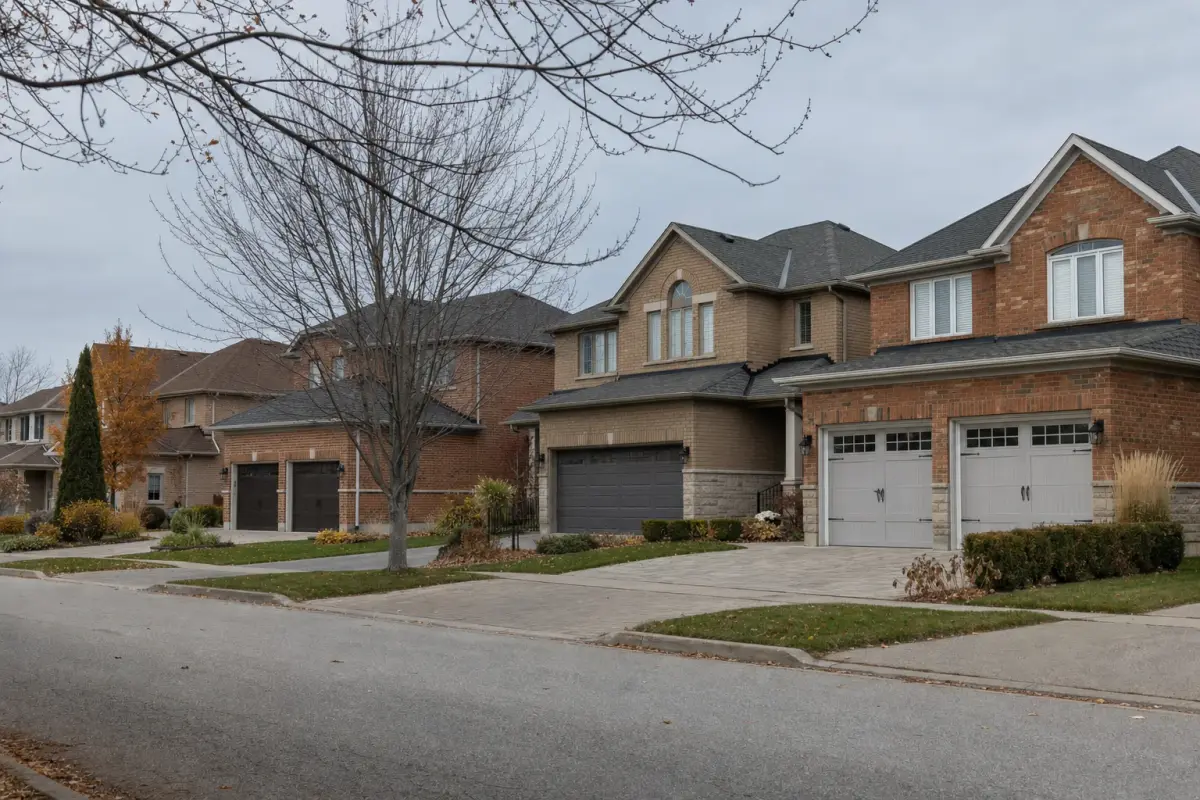
What you pay depends heavily on the kind of home. Freehold houses, where the buyer owns both the building and the land, averaged roughly twice what townhouses did and well over double the price of a condo.
Even after the slide since spring, Oakville's October average was higher than Toronto's and far above the Ontario-wide average for residential sales.
The figures cover MLS resale listings in RoofUp's data and are not official numbers from the Toronto Regional Real Estate Board or the Canadian Real Estate Association, the real estate industry groups that publish their own market reports.